
Normal Operation – Reactor Control
After synchronization of the generator, the reactor control system is usually switched to automatic control, and the additional power increase is in this mode. After determining that all systems (NSSS and turbine-generator) are functioning properly at the initial load (e.g., 30% of rated power), the plant loading is continued to full power at a limited rate. This rate usually does not exceed 5 percent of rated power per minute. After refueling, the power increase can be further limited to minimize fuel cladding strain (e.g., 1 percent of rated power per hour). During this power increase (from 30% to 100% of rated power), additional startup tests can be performed to verify power distribution requirements.
Positive reactivity must be continuously inserted (via control rods or boron dilution) to maintain the trend of power increase (from 30% to 100% of rated power). After each reactivity insertion, the reactor power stabilizes itself on the power level proportionately to the reactivity inserted. The total amount of feedback reactivity that must be offset by control rod withdrawal or boron dilution during the power increase is known as the power defect. The negative reactivity of xenon and samarium production is also counteracted by diluting soluble poison from the coolant and controlling rods withdrawal.
During reactor operation at nominal power, numerous parameters such as temperature, pressure, power level, and coolant flow are continuously monitored and controlled to ensure the safe and stable operation of the reactor. The specific effects of variations in these parameters vary greatly depending upon reactor design, but generally, the effects for thermal reactors are as follows.
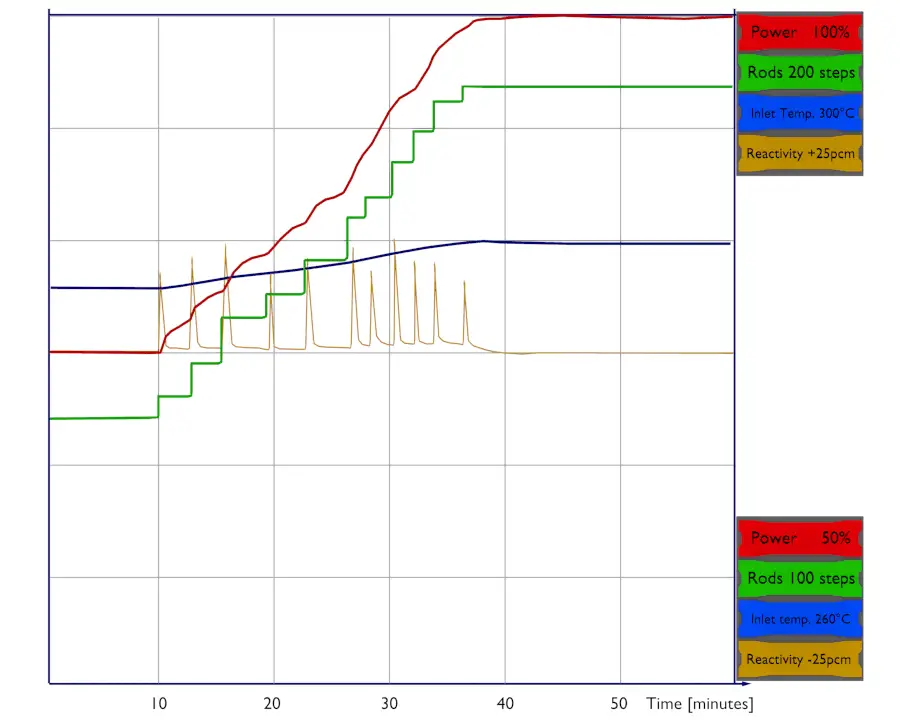
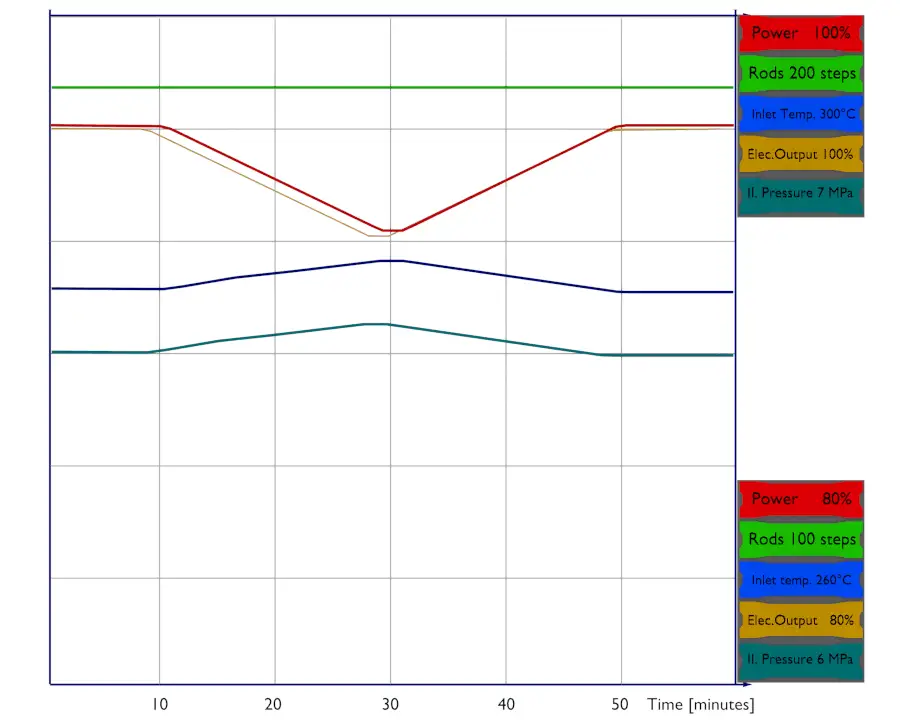
Let’s assume that the reactor is critical at 75% of rated power and that the plant operator wants to increase power to 100% of rated power. The reactor operator must first bring the reactor supercritical by inserting a positive reactivity (e.g., by control rod withdrawal or boron dilution). As the thermal power increases, moderator temperature and fuel temperature increase, causing a negative reactivity effect (from the power coefficient), and the reactor returns to the critical condition. Positive reactivity must be continuously inserted (via control rods or chemical shim) to keep the power to be increasing. After each reactivity insertion, the reactor power stabilizes itself proportionately to the reactivity inserted. The total amount of feedback reactivity that must be offset by control rod withdrawal or boron dilution during the power increase (from ~1% – 100%) is known as the power defect.
Let assume:
- the power coefficient: Δρ/Δ% = -20pcm/% of rated power
- differential worth of control rods: Δρ/Δstep = 10pcm/step
- worth of boric acid: -11pcm/ppm
- desired trend of power decrease: 1% per minute
75% → ↑ 20 steps or ↓ 18 ppm of boric acid within 10 minutes → 85% → next ↑ 20 steps or ↓ 18 ppm within 10 minutes → 95% → final ↑ 10 steps or ↓ 9 ppm within 5 minutes → 100%
Reactor Power Control
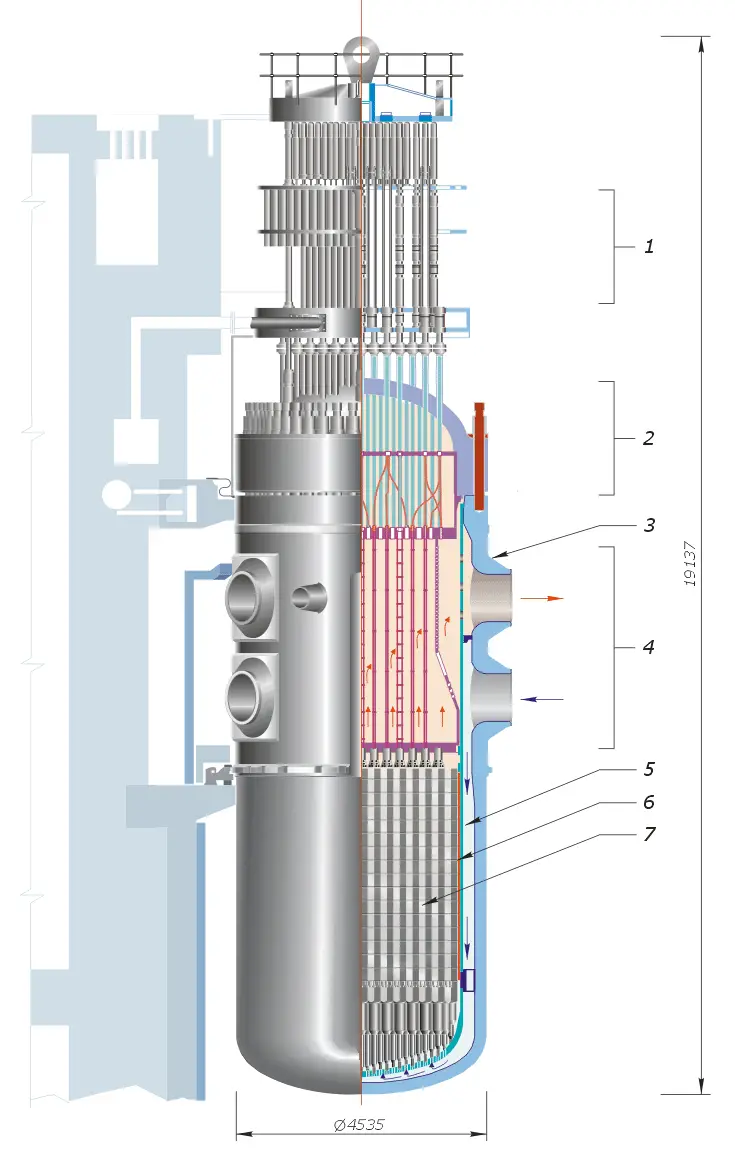
1) Control Element Drive Mechanism
2) Reactor vessel head
3) Reactor pressure vessel
4) Coolant inlet-outlet nozzles
5) Downcomer for coolant
6) Neutron reflector
7) Fuel assemblies
Source: www.wikipedia.org
In general, the reactor thermal power and the outlet temperature of the coolant from the reactor core are controlled by manipulating several factors which affect the core’s reactivity. In PWRs, these factors are especially:
- position of control rods,
- the concentration of boric acid in the RCS
- core inlet temperature
Control Rods
Control rods are rods, plates, or tubes containing a neutron absorbing material (material with high absorption cross-section for thermal neutron) such as boron, hafnium, cadmium, etc., used to control the power of a nuclear reactor. Control rods usually constitute cluster control rod assemblies (PWR) and are inserted into guide thimbles within a nuclear fuel assembly. The absorbing material (e.g., pellets of Boron Carbide) is protected by the cladding, usually made of stainless steel. They are grouped into groups (banks), and the movement usually occurs by the groups (banks). The typical total number of clusters is 70. This number is limited, especially by the number of penetrations of the reactor pressure vessel head.
A control rod is removed from or inserted into the reactor core to increase or decrease the reactivity of the reactor (increase or decrease the neutron flux). Control rods (insertion/withdrawal) influence the thermal utilization factor. For example, control rods insertion causes the addition of new absorbing material into the core, and this causes a decrease in thermal utilization factor.
Compared with the chemical shim, which offset positive reactivity excess in the entire core, with control rods, the unevenness of neutron-flux density in the reactor core may arise because they act locally.
The concentration of Boric Acid
In pressurized water reactors, chemical shim (boric acid) is used to compensate for an excess of reactivity of reactor core along the fuel burnup (long term reactivity control) as well as to compensate for the negative reactivity from the power defect and xenon poisoning during power increase to nominal power.
The concentration of boric acid diluted in the primary coolant influences the thermal utilization factor. For example, an increase in the concentration of boric acid (chemical shim) causes the addition of new absorbing material into the core, and this causes a decrease in the thermal utilization factor.
Compared with burnable absorbers (long-term reactivity control) or control rods (rapid reactivity control), the boric acid avoids the unevenness of neutron-flux density in the reactor core because it is dissolved coolant homogeneously in the entire reactor core. On the other hand, high concentrations of boric acid may lead to a positive moderator temperature coefficient, which is undesirable. In this case, more burnable absorbers must be used.
Moreover this method is slow in controlling reactivity. Normally, it takes several minutes to change the concentration (dilute or borate) of the boric acid in the primary loop. For rapid changes of reactivity control rods must be used.
The power distribution significantly changes also with changes in the thermal power of the reactor. During power changes at power operation mode (i.e., from about 1% up to 100% of rated power), the temperature reactivity effects play a very important role. As the neutron population increases, the fuel and the moderator increase their temperature, which results in a decrease in reactivity of the reactor (almost all reactors are designed to have the temperature coefficients negative). The negative reactivity coefficient acts against the initial positive reactivity insertion, and this positive reactivity is offset by negative reactivity from temperature feedbacks.
This effect naturally occurs on a global scale and also on a local scale.
During thermal power increase, the effectiveness of temperature feedbacks will be greatest where the power is greatest. This process causes the flattening of the flux distribution because the feedback acts stronger on positions where the flux is higher.
It must be noted the effect of change in the thermal power have significant consequences on the axial power distribution (global power distribution).
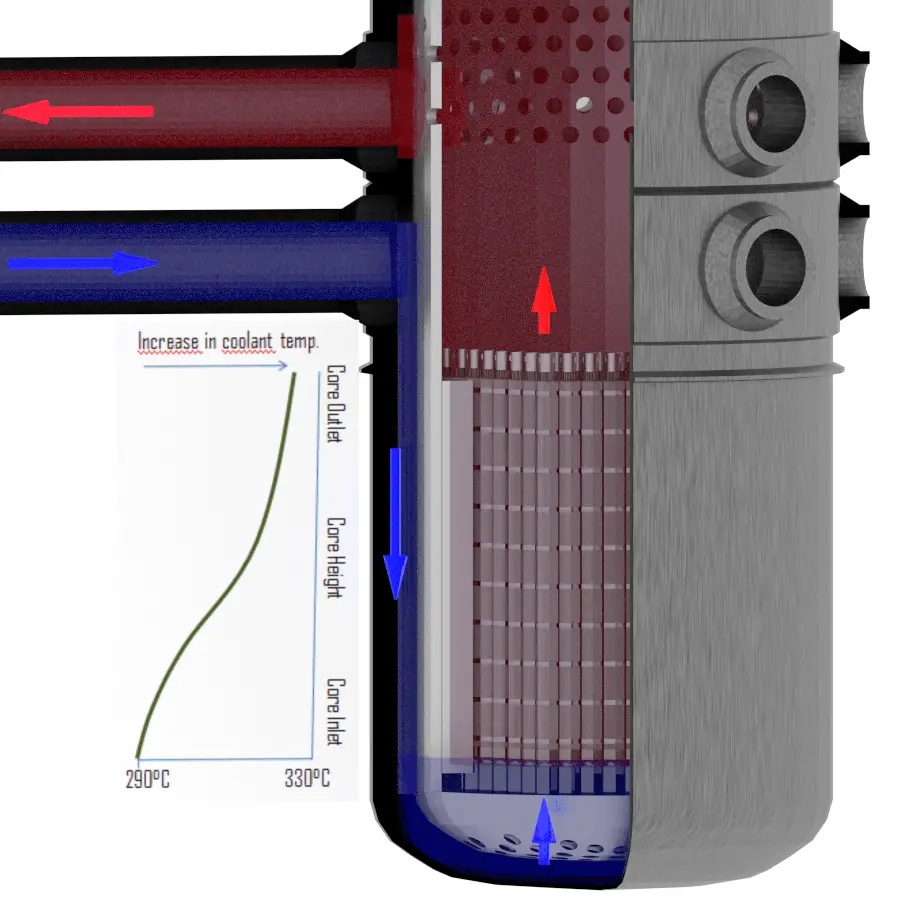
In reality, when there is a change in the thermal power, and the coolant flow rate remains the same, the difference between inlet and outlet temperatures must increase. It follows from the basic energy equation of reactor coolant, which is below:
P=↓ṁ.c.↑∆t
Power increase. Let’s assume that the reactor is critical at 75% of rated power and that the plant operator wants to increase power to 100% of rated power.
The inlet temperature is determined by the pressure in the steam generators. Therefore the inlet temperature changes minimally during the change of thermal power. It follows the outlet temperature must change significantly as the thermal power changes. When the inlet temperature remains almost the same, and the outlet changes significantly, it stands to reason the average temperature of coolant (moderator) will also change significantly. It follows the temperature of the top half of the core increases more than the temperature of the bottom half of the core. Since the moderator temperature feedback must be negative, the power from the top half will shift to the bottom half. In short, the top half of the core is cooled (moderated) by hotter coolant, and therefore it is worse moderated. Hence the axial flux difference, defined as the difference in normalized flux signals (AFD) between the top and bottom halves of a two-section excore neutron detector, will decrease.
AFD is defined as:
AFD or ΔI = Itop – Ibottom
where Itop and Ibottom are expressed as a fraction of rated thermal power.
Nuclear Power Plant Control – Electric Power Control

As was written, after synchronization of the generator, the reactor control system is usually switched to automatic control, and the additional power increase is in this mode. The plant control system then controls the power plant that coordinates the NSSS and the turbine control system. The interfacing variable is, in this case, the core inlet temperature, which is fully determined by steam pressure inside steam generators. Note that the core inlet temperature and the steam pressure are interconnected since heat (or power) transferred across a steam generator is:
q = h . ΔT
where:
- q is the amount of heat transferred (heat flux), W/m2, i.e., thermal power per unit area
- h is heat transfer coefficient, W/(m2.K)
- ΔT is the difference in temperature across the steam generator (in this case, the difference between the average temperature of the reactor coolant – Tavg and the saturation temperature determined by system pressure.
For all practical purposes, the heat transfer coefficient (h) is constant since the heat transfer coefficient is a function of the materials used in constructing the steam generator. The U-tubes are completely covered with water.
See also: Steam Turbine
A reactor is in automatic control follows the core inlet temperature – Tin (or the core average temperature – Tavg). Note that Tavg = (Tout + Tin) / 2. When there is a difference between actual Tin, actual and the temperature Tin, set, which is set in the system, the reactor control system initiates control rods movement. For example, when Tin, actual > Tin, set, the reactor control system automatically inserts control rods to decrease Tin, actual. The reactor thermal power remains constant because the rod’s movement only offsets the reactivity from the difference (Tin, actual – Tin, set) x MTC = moderator defect.
On the other hand, if the energy demand in the external system increases, more energy is removed from the reactor system, causing the temperature of the reactor coolant (Tin) to decrease. As the reactor coolant temperature decreases, positive reactivity is added, resulting in a corresponding increase in reactor power level. This reactor power increase occurs without any change in control rods position and without any change in boron concentration. The same inherent stability can be observed as the energy demand on the system is decreased.
It must be added in case of disconnected automatic control, the turbine controls the steam pressure, and the reactor control system is in a manual regime. In this case, a control rods insertion causes a decrease in reactor thermal power since the steam pressure remains constant. The turbine load decreases as the reactor thermal power decreases.
See also: Reactor Stability
- Constant Pressure Regime (sliding Tavg). Constant pressure (psteam) regime means that the reactor control system maintains the steam pressure inside steam generators (or at the turbine inlet) constant as turbine load changes. Also, in this case, the automatic system follows Tavg, set, but Tavg, set is a function of turbine load. For example, increasing turbine load causes steam pressure to decrease. The reactor control system would sense this decrease in steam pressure and withdraw control rods to increase the reactor coolant temperature. This type of reactor control produces ideal steam conditions at the main turbine inlet for all loads from the initial load (e.g., 30%) to 100% load. The temperature difference (ΔT) between the primary and secondary sides is increased by raising Tavg or proportionally by raising Tin. The disadvantage of this type of control scheme is that just minimal changes in turbine load require (negative MTC) intervention of the reactor control system. Moreover, there are problems within a high reactor outlet temperature (Tout), which approaches saturation values. Therefore it is not widely used in PWRs, especially for U-tube steam generators.
- Constant Tavg Regime (sliding psteam). Constant Tavg regime means that the reactor control system maintains the average core temperature of the reactor coolant constant as turbine load changes. The automatic system follows Tavg, set, which is constant. For example, increasing turbine load causes steam pressure to decrease. This, in turn, causes Tavg to decrease because the turbine uses more energy than that produced by the reactor. The reactor control system would sense this decrease in Tavg and withdraw control rods to increase the reactor coolant temperature. This regime causes minimal changes in the reactivity of the core due to minimal changes in the average coolant temperature. Since the coolant temperature remains constant, the coolant volume does not change, and therefore, the pressurizer level remains constant for all load conditions. The disadvantage of this type of control scheme is that steam conditions (steam pressure) significantly change from hot zero power to full load, which is unacceptable.
-
Sliding Tavg and Sliding psteam Regime. The automatic system follows Tavg, set, but Tavg, set is a function of turbine load, and it is programmed for the best performance of the entire system. Sliding Tavg and Sliding psteam Regime. This regime combines the previous regimes. The automatic system follows Tavg, set, but Tavg, set is a function of turbine load, and it is programmed for the best performance of the entire system. Sometimes, there are many programmed functions of Tavg, set for different purposes (e.g., for initial power increase, load-follow, or coast down). The control scheme most often selected to control the reactor is the sliding Tavg and sliding psteam regime. This regime is a compromise between the other two regimes of control and contains some of the advantages and disadvantages of each.
Pressure Control
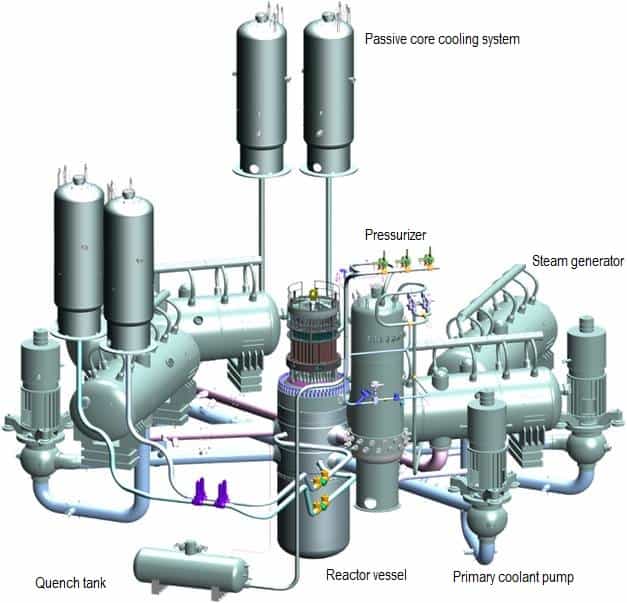
Source: gidropress.podolsk.ru
used with permission of АО ОКБ “ГИДРОПРЕСС”
Pressurized water reactors use a reactor pressure vessel (RPV) to contain the nuclear fuel, moderator, control rods, and coolant. They are cooled and moderated by high-pressure liquid water (e.g., 16MPa). At this pressure, water boils at approximately 350°C (662°F). This high pressure is maintained by a pressurizer, a separate vessel connected to the primary circuit (hot leg), and partially filled with water heated to the saturation temperature (boiling point) for the desired pressure by submerged electrical heaters.
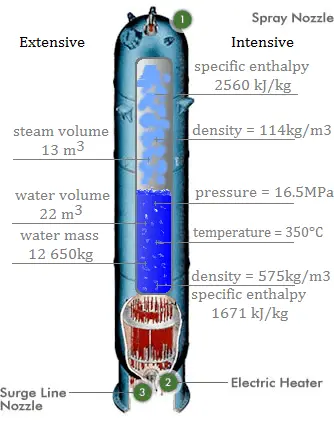
On the other hand, there are spray lines to decrease pressure inside the pressurizer, which in turn causes a decrease in pressure in the reactor coolant system. These spray lines spray reactor coolant from the cold leg of a loop into the steam space and condense a portion of the steam. The quenching action reduces pressure and limits the pressure increases.
The temperature in the pressurizer can be maintained at 350 °C (662 °F), which gives a subcooling margin (the difference between the pressurizer temperature and the highest temperature in the reactor core) of 30 °C. Subcooling margin is a very important safety parameter of PWRs since the boiling in the reactor core must be excluded. The basic design of the pressurized water reactor includes such a requirement that the coolant (water) in the reactor coolant system must not boil. To achieve this, the coolant in the reactor coolant system is maintained at a pressure sufficiently high that boiling does not occur at the coolant temperatures experienced while the plant is operating or in an analyzed transient.
The pressure applied to the reactor system can also affect reactor operation by causing changes in reactivity. The reactivity changes result from changes in the density of the moderator in response to the pressure changes. Although water is considered incompressible, in reality, it is slightly compressible (especially at 325°C (617°F)). The effect of pressure in the primary circuit has similar consequences as the moderator temperature. Compared with the effects of moderator temperature changes, changes in pressure have a lower-order impact on reactivity. The causes are only in the density of the moderator, not in the change of microscopic cross-sections.
For example, as the system pressure rises, the moderator density increases and results in greater moderation, less neutron leakage, and therefore positive reactivity insertion. A reduction in the system pressure results in the addition of negative reactivity. In two-phase systems such as boiling water reactors (BWR), however, the effects of pressure changes are more noticeable because there is a greater change in moderator density for a given change in system pressure.
Over-pressure Relief System
Part of the pressurizer system is an over-pressure relief system. If pressurizer pressure exceeds a certain maximum, there is a relief valve called the pilot-operated relief valve (PORV) on top of the pressurize, which opens to allow steam from the steam bubble to leave the pressurizer to reduce the pressure in the pressurizer, thus leading to reduction of pressure in the whole system. This steam is routed to a large relief tank in the reactor containment building, where it is cooled and condensed back into the liquid and stored for later disposition. There is a finite volume to these tanks. If events deteriorate to the point where the tanks fill up, a secondary pressure relief device on the tank(s), often a ruptured disc, allows the condensed reactor coolant to spill out onto the floor of the reactor containment building, where it pools in sumps for later disposition.
The pressurizer is also equipped with a safety valves system (“safety system”), which is also routed to the relief tank. The safety valves system is used for emergency pressure reduction during emergency conditions.
Typical Pressures in Nuclear Engineering
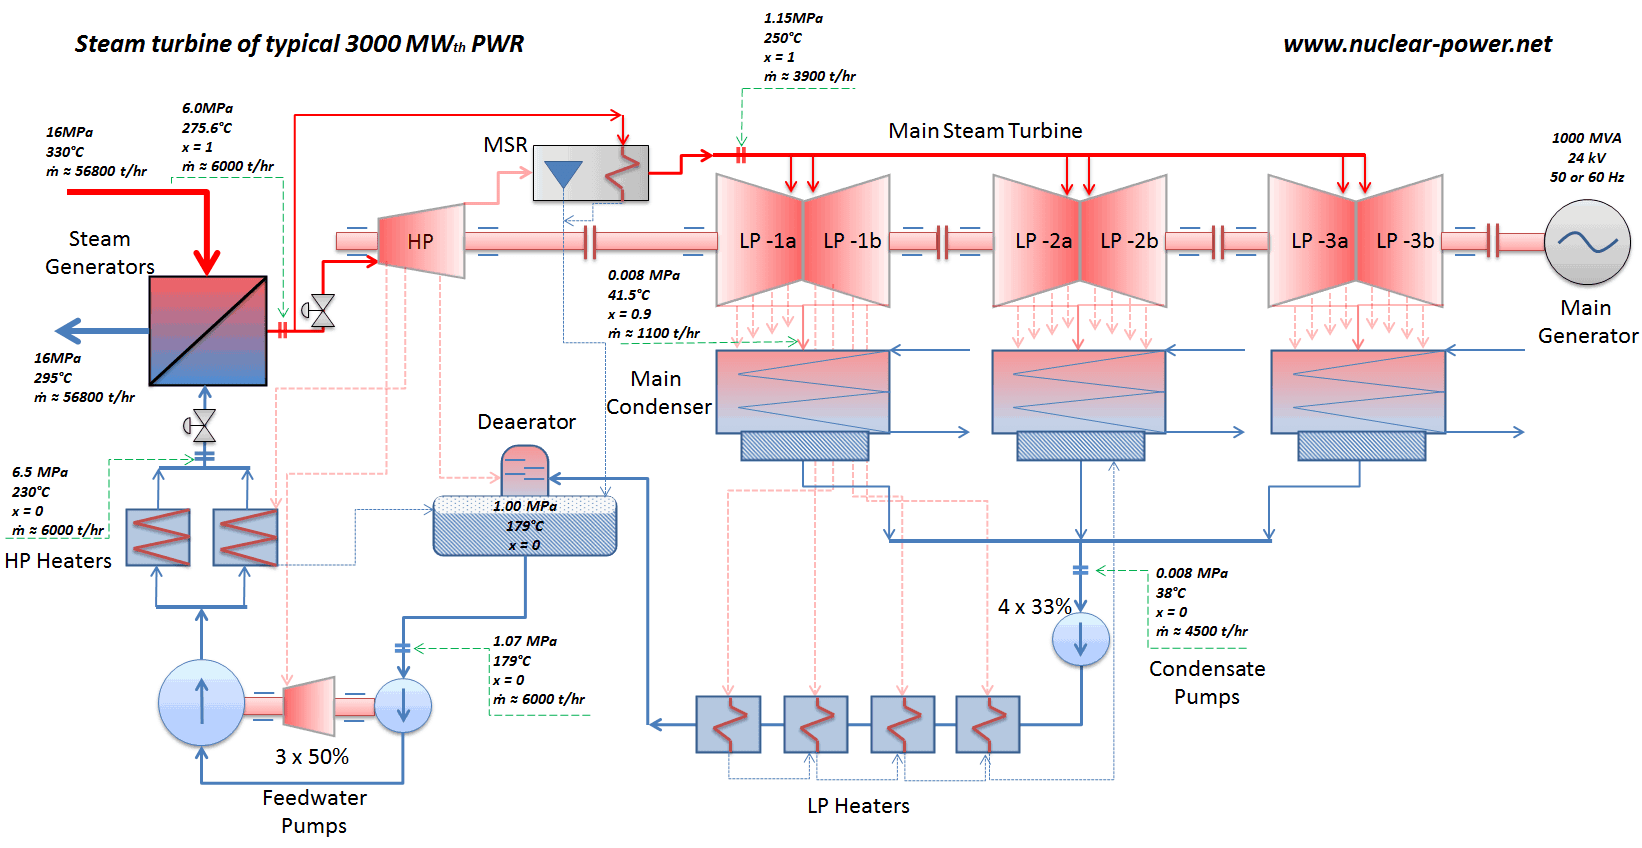
- Typically most nuclear power plants operate multi-stage condensing steam turbines. These turbines exhaust steam at a pressure well below atmospheric (e.g., at 0.08 bar or 8 kPa or 1.16 psia) and in a partially condensed state. In relative units, it is a negative gauge pressure of about – 0.92 bar, – 92 kPa, or – 13.54 psig.
- A high-pressure stage of condensing steam turbine at nuclear power plant operates at steady state with inlet conditions of 6 MPa (60 bar, or 870 psig), t = 275.6°C, x = 1
- A boiling water reactor is cooled and moderated by water like a PWR, but at a lower pressure (e.g., 7MPa, 70 bar, or 1015 psig), which allows the water to boil inside the pressure vessel producing the steam that runs the turbines.
- Pressurized water reactors are cooled and moderated by high-pressure liquid water (e.g., 16MPa, 160 bar, or 2320 psig). At this pressure, water boils at approximately 350°C (662°F), which provides a subcooling margin of about 25°C.
- The supercritical water reactor (SCWR) is operated at supercritical pressure. The term supercritical in this context refers to the thermodynamic critical point of water (TCR = 374 °C; pCR = 22.1 MPa)
Temperature Control
As was written, the interfacing variable is in pressurized water reactors the core inlet temperature, which is fully determined by steam pressure inside steam generators. Note that the core inlet temperature and the steam pressure are interconnected since heat (or power) transferred across a steam generator is:
q = h . ΔT
where:
- q is the amount of heat transferred (heat flux), W/m2, i.e., thermal power per unit area
- h is heat transfer coefficient, W/(m2.K)
- ΔT is the difference in temperature across the steam generator (in this case, the difference between the average temperature of the reactor coolant – Tavg and the saturation temperature determined by system pressure.
For all practical purposes, the heat transfer coefficient (h) is constant since the heat transfer coefficient is a function of the materials used in constructing the steam generator, and the U-tubes are completely covered with water.
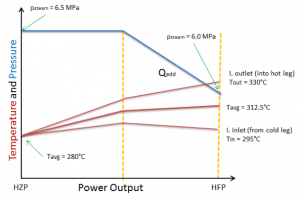
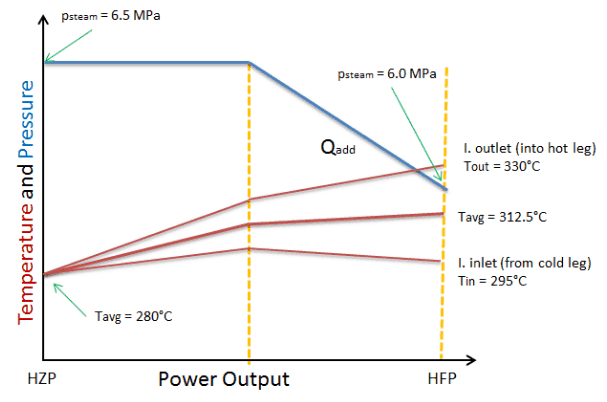
System parameters in steam generators directly give the core inlet temperature. When steam generators are operated at approximately 6.0MPa, it means the saturation temperature is equal to 275.6 °C. Since there must always be ΔT (~15°C) between the primary circuit and the secondary circuit, the reactor coolant (in the cold leg) have about 290.6°C (at HFP) at the inlet of the core. As the system pressure increases, the core inlet temperature must also increase, and this increase causes a slight increase in fuel temperature.
See also: Power Plant Control
The most significant effect of a variation in temperature upon reactor operation is the addition of positive or negative reactivity. As previously discussed, reactors are generally designed with negative temperature coefficients of reactivity (moderator and fuel temperature coefficients) as a self-limiting safety feature. A rise in reactor temperature results in the addition of negative reactivity. If the rise in temperature is caused by an increase in reactor power, the negative reactivity addition slows and eventually turns the increase in reactor power. This is a highly desirable effect because it provides negative feedback in the event of an undesired power excursion.
See also: Reactor Stability
Power Distribution Limits
Nuclear reactors produce an enormous amount of heat (energy) in a small volume. The density of the energy generation is very large, which puts demands on its heat transfer system (reactor coolant system). For a reactor to operate in a steady-state, all of the heat released in the system must be removed as fast as it is produced. This is accomplished by passing a liquid or gaseous coolant through the core and through other regions where heat is generated. The heat transfer must be equal to or greater than the heat generation rate or overheating, and possible damage to the fuel may occur.
The temperature in an operating reactor varies from point to point within the system. Consequently, there is always one fuel rod and one local volume hotter than all the rest. The peak power limits must be introduced to limit these hot places. The peak power limits are associated with such phenomena as the departure from nucleate boiling and the conditions that could cause fuel pellet melt.
Therefore power distribution within the core must be properly limited. These limitations are usually divided into two basic categories:
- Limitation of global power distribution
- Axial flux difference
- Power tilt
- Limitation of local power distribution
- Local Heat Flux
- Enthalpy Rise in Hot Channel
Axial Flux Difference – Axial Offset
 At power operation (i.e., above 1% of rated power), the reactivity feedbacks cause the flattening of the flux distribution because the feedbacks acts stronger on positions where the flux is higher. It follows there must be differences also in an axial direction.
For example, let assume the inlet temperature (Tin), determined by the pressure in the steam generators. Therefore the inlet temperature changes minimally as the thermal power changes. It follows the outlet temperature must change significantly as the thermal power increases. When the inlet temperature remains almost the same, and the outlet changes significantly, it stands to reason the average temperature of coolant (moderator) will also change significantly. It follows the temperature of the top half of the core increases (in case of power increase) more than the temperature of the bottom half of the core. Since the moderator temperature feedback must be negative, the power from the top half will shift to the bottom half. Hence the axial flux difference, defined as the difference in normalized flux signals (AFD) between the top and bottom halves of a two-section excore neutron detector, will decrease.
AFD is defined as:
AFD or ΔI = Itop – Ibottom
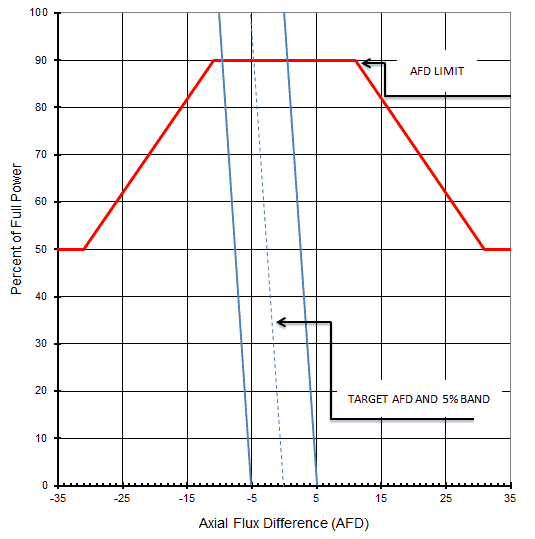
where Itop and Ibottom are expressed as a fraction of rated thermal power, as an example, assume the core is operating at 100% power. When the Itop = 49% and Ibottom = 51% the resulting ΔI = -2%. When the delta flux target is -5%. The core would then be able to operate with a delta flux of -10% to 0%. The + 5% and -5% flux difference around the target allows for a small movement of the control rods.
During power operation, the AFD is maintained within the specified limits. Compliance with the AFD limits prevents a highly top- or bottom skewed axial power distribution. By limiting the amount of power distribution skewing, core peaking factors are consistent with the assumptions used in the safety analyses. Limiting power distribution skewing over time minimizes the xenon distribution skewing, a significant factor in axial power distribution control.
The operating scheme used to control the axial power distribution involves maintaining the AFD within a tolerance band around a burnup dependent target, known as the target flux difference, minimizing the variation of the axial peaking factor and axial xenon distribution during unit maneuvers.
For plants operating with so-called “constant axial offset control – CAOC”, the AFD limit involves a target band. This target band is, for example, +5% and -5% around the target value. Since the xenon concentration and distribution are flux and time-dependent, the longer the core operates outside its target band, the greater the probability of initiating a xenon transient.
At equilibrium xenon conditions, the target flux difference (ΔItarget) and its burnup dependent value are determined. The AFD is sensitive to many-core-related parameters such as control bank positions, core power level, axial burnup, axial xenon distribution, and, to a lesser extent, reactor coolant temperature and boron concentrations.
Constant Axial Offset Control (CAOC) is a strategy used to control axial power distribution in normal operations. CAOC requires that the AFD must be controlled within a narrow tolerance band around a burnup-dependent target to minimize the probability of initiation xenon oscillations during power maneuvers. It also minimizes the variation of axial peaking factors.
Axial offset is defined as:
A/O = (Itop – Ibottom)/(Itop + Ibottom)
where Itop and Ibottom are expressed as a fraction of rated thermal power.
AFD and Safety Analyses
In summary, the AFD and the QPTR are direct and continuous measures of the core’s global power distribution. AFD measures global axial power distribution, whereas QPTR measures global azimuthal power distribution. Staying within their limits and proper operation of the control rods should continuously maintain acceptable peaking factors (FQ(z) and FΔH). The AFD and QPTR limits ensure that peaking factors (FQ(z) and FΔH) remain below their limiting values by preventing an undetected change in the gross axial and radial power distribution.
Together, the LCO limits on the AFD, the QPTR, the rod insertion limits and the power distribution (i.e., the Heat Flux Hot Channel Factor (FQ(z)), the Nuclear Enthalpy Rise Hot Channel Factor (FNΔH)) are established to preclude core power distributions that exceed the safety analyses limits.
Power Tilt – Flux Tilt – Quadrant – Sextant Symmetry
A power tilt, or flux tilt, is a specific type of core power distribution problem. It is a non-symmetrical variation of core power in one quadrant (PWRs) or one sextant (WWERs) of the core relative to the others. The power in one quadrant (or sextant) might be suppressed by over-insertion of control rods in that quadrant of the core, which results in a relatively higher flux in the remainder for a constant overall power level of the core. This situation can also lead to spatial xenon oscillations (azimuthal oscillations).
Therefore, plant operators define a parameter known as quadrant power tilt (QPT) or quadrant power tilt ratio (QPTR) in the Technical Specifications.
Special link: NRC – Standard Technical Specifications
QPTR is defined as:
The ratio of the maximum upper excore detector calibrated output to the average of the upper excore detector calibrated outputs, or the ratio of the maximum lower excore detector calibrated output to the average of the lower excore detector calibrated outputs, whichever is greater.
QPTR is usually provided by four or six tandem (upper and lower) excore power range neutron detectors, which belong to so-called the excore nuclear instrumentation system (NIS). During normal operation, this parameter must be continuously verified. The limit (Limiting Condition for Operation – LCO) for QPRT and SPTR is usually QPTR < 1.02. Operation beyond these limits could invalidate core power distribution assumptions used in the accident analysis.
QPTR and Safety Analyses
In summary, the AFD and the QPTR are direct and continuous measures of the core’s global power distribution. AFD measures global axial power distribution, whereas QPTR measures global azimuthal power distribution. Staying within their limits and proper operation of the control rods should continuously maintain acceptable peaking factors (FQ(z) and FΔH). The AFD and QPTR limits ensure that peaking factors (FQ(z) and FΔH) remain below their limiting values by preventing an undetected change in the gross axial and radial power distribution.
Together, the LCO limits on the AFD, the QPTR, the rod insertion limits and the power distribution (i.e., the Heat Flux Hot Channel Factor (FQ(z)), the Nuclear Enthalpy Rise Hot Channel Factor (FNΔH)) are established to preclude core power distributions that exceed the safety analyses limits.
Hot Channel (Peaking) Factors
Heat Flux Hot Channel Factor – FQ(z)
The Heat Flux Hot Channel Factor – FQ(z) is defined as:
- The maximum local linear power density ratio, where there is a minimal margin to limiting fuel temperature (during AOOs), to the average local linear power density in the core.
- The maximum local linear power density [kW/ft] in the core is divided by the core average fuel rod linear power density [kW/ft].
Operation within the Heat Flux Hot Channel Factor – FQ(z) limits prevents power peaks that exceed the loss of coolant accident (LOCA) limits derived from the analysis of the Emergency Core Cooling Systems (ECCS). In this analysis, fuel cladding failure during a postulated LOCA is limited by restricting the maximum linear heat rate (LHR) so that the peak cladding temperature does not exceed the acceptance criterion (e.g., 2200°F or 1204°C). Cladding temperatures below this criterion exclude severe cladding failure by oxidation due to a cladding-steam reaction. The Heat Flux Hot Channel Factor – FQ(z) is an assumption in these and other analyses, as well as it is an assumption for Safety Limits (SLs) calculations. Operation beyond the Heat Flux Hot Channel Factor – FQ(z) could invalidate core power distribution assumptions used in these analyses (Safety Analyses and Safety Limits derivation).
Now, consider a case where power distribution is limited only by the FQ(z). But FQ(z) can be limiting at each elevation of the core (axially flat distribution). The maximum heat flux at several core elevations can occur in the same channel. In this case, the coolant enthalpy rise would be very high, most probably over-limit. In this case, DNB is more likely to occur because the critical heat flux is significantly lower when coolant enthalpy is higher. Therefore, the FQ(z) itself cannot be used to prevent DNB occurrence, and the enthalpy rise hot channel factor must be introduced.
Nuclear Enthalpy Rise Hot Channel Factor – FNΔH
The Nuclear Enthalpy Rise Hot Channel Factor – FNΔH is defined as:
- The ratio of the integral of linear power along the fuel rod on which minimum departure from nucleate boiling ratio occurs (during AOOs) to the average fuel rod power in the core.
- The ratio of the integral of linear power along the fuel rod with the highest integrated power [kW/rod] to the average rod power [kW/rod].
Operation within the Nuclear Enthalpy Rise Hot Channel Factor – FNΔH limits prevents departure from nucleate boiling (DNB) during accidents that are limiting from DNB point of view. For example, a loss of forced reactor coolant flow accident, a loss of normal feedwater flow, or an inadvertent opening of a pressurizer relief valve. The Nuclear Enthalpy Rise Hot Channel Factor FNΔH is an assumption in these and other analyses and an assumption for Safety Limits (SLs) calculations. Its merit is that FNΔH provides information about power distribution and the coolant temperature (enthalpy), which are crucial for DNB occurrence. Operation beyond the Nuclear Enthalpy Rise Hot Channel Factor – FNΔH could invalidate core power distribution assumptions used in these analyses (Safety Analyses and Safety Limits derivation).
DNB occurs when a fuel rod cladding surface is overheated, which causes the formation of a local vapor layer, causing a dramatic reduction in heat transfer capability. Proximity to the DNB condition is expressed by the departure from nucleate boiling ratio (DNBR), defined as the ratio of the cladding surface heat flux (known as the critical heat flux) required to cause DNB to the actual cladding surface heat flux. The minimum DNBR value during both normal operation and anticipated transients is limited to the DNBR correlation limit for the particular fuel design in use. It is accepted as an appropriate margin to DNB. The DNB acceptance criterion for an anticipated operational occurrence (AOO) is met when there is a 95 percent probability at a 95 percent confidence level (the 95/95 DNB criterion) that DNB will not occur, and the fuel centerline temperature stays below the melting temperature.
Base Load vs. Load Follow

Nuclear power plants may take many hours, if not days, to startup or change their power output. Modern power plants can operate as load-following power plants and alter their output to meet varying demands. But baseload operation is the most economical and technically simple mode of operation. It is primarily because they require a long time to heat up the nuclear steam supply system and the turbine-generator to operating temperature. From this point of view, power plant generally is divided into two basic categories:
- Base Load Power Plant
- Load Following Power Plant
Base Load Power Plant
 In general, nuclear power plants (NPPs) have been considered as baseload sources of electricity as they rely on technology with low variable costs and high fixed costs. This is the most economical and technically simple mode of operation. In this mode, power changes are limited to frequency regulation for grid stability purposes and shutdowns for safety purposes. Different plants and technologies may have differing capacities to power changes on demand. Baseload power plants are generally run at close to maximum output (100% of rated power) continuously (apart from maintenance refueling outages). During refueling, every 12 to 18 months, some of the fuel – usually one-third or one-quarter of the core – is replaced by fresh fuel assemblies. After refueling, the reactor is usually started up and operated again at nominal power.
Although most nuclear power plants were designed as baseload power plants, today, the utilities have had to implement or improve the maneuverability capabilities of their NPPs to be able to adapt the electricity supply to daily, seasonal, or other variations in power demand. Due to the share of nuclear power in the national electricity mix of some countries has become large due to the significant increase in renewable energy sources.
Load Following Power Plant
As was written, nuclear power plants (NPPs) have been considered baseload sources of electricity as they rely on technology with low variable costs and high fixed costs. However, that situation is changing in several countries. Today, the main motivation for load following with nuclear power plants comes from the large-scale deployment of intermittent electricity sources (like wind and solar power). An intermittent energy source is any source of energy or electrical power that is not continuously available due to some factor outside direct control. For example, in the absence of an energy storage system, solar does not produce power at night or in bad weather and varies between summer and winter.
On the other hand, electrical energy must be generated at the same rate at which it is consumed. A sophisticated control system is required to ensure that the power generation closely matches the demand. If the power demand exceeds supply, the imbalance can cause power plants and transmission equipment to disconnect and/or shut down to prevent damage automatically. This may lead to a cascading series of shutdowns and a major regional blackout in the worst case. The challenge is not only technical. Due to the sudden influx of large amounts of wind power, German, Dutch, Czech, and Austrian power markets have experienced several hours of negative electricity prices in recent years and many more hours with prices that were lower than the variable costs of nuclear power plants, which have the lowest variable costs among the large-scale established power sources. Moreover, the load follows operation is economically very inefficient as nuclear power generation is composed almost entirely of fixed and sunk costs. Therefore, lowering the power output doesn’t significantly reduce generating costs and the plant.
To manage this problem, the utilities have had to implement or improve the maneuverability capabilities of their NPPs to be able to adapt the electricity supply to daily, seasonal, or other variations in power demand. The power plant with this improved maneuverability is known as the load-following power plant. In general, the load following a power plant is a power plant that adjusts its power output as electricity demand fluctuates throughout the day. Load following plants are typically in-between baseload and peaking power plants.
For example, according to the current version of the European Utilities Requirements (EUR), the nuclear power plant must be capable of daily load cycling operation between 50% and 100 % of its rated power, with a rate of change of the electric output of 3-5% of rated power per minute.
From the reactor operation viewpoint, in the case of pressurized water reactors (PWRs), the reactor thermal power and the global power distribution (especially the AFD) are controlled by manipulating several factors which affect the core’s reactivity. In PWRs, these factors are especially:
- position of control rods,
- the concentration of boric acid in the RCS
- core inlet temperature
A control rod is removed from or inserted into the reactor core to increase or decrease the reactivity of the reactor (increase or decrease the thermal power). For example, control rods insertion causes the addition of new absorbing material into the core, and this causes a decrease in thermal power.
Boric acid is used to compensate for an excess of reactivity of reactor core along the fuel burnup (long-term reactivity control) and compensate for the negative reactivity from the power defect and xenon poisoning during power increase nominal power.
Special attention requires the axial flux difference control. The axial flux difference is defined as the difference in normalized flux signals (AFD) between the top and bottom halves of a two-section excore neutron detector:
AFD or ΔI = Itop – Ibottom
The AFD is sensitive to many-core-related parameters such as control bank positions, core power level, axial burnup, axial xenon distribution, and, to a lesser extent, reactor coolant temperature and boron concentrations.
During power maneuvers, the operating scheme used to control the axial power distribution involves maintaining the AFD within a tolerance band around a burnup-dependent target, known as the target flux difference, minimizing the variation of the axial peaking factor and axial xenon distribution.
For plants operating with so-called “constant axial offset control – CAOC”, the AFD limit involves a target band. This target band is, for example, +5% and -5% around the target value. Since the xenon concentration and distribution are flux and time-dependent, the longer the core operates outside its target band, the greater the probability of initiating a xenon transient.
Load Follow without Boron Adjustment
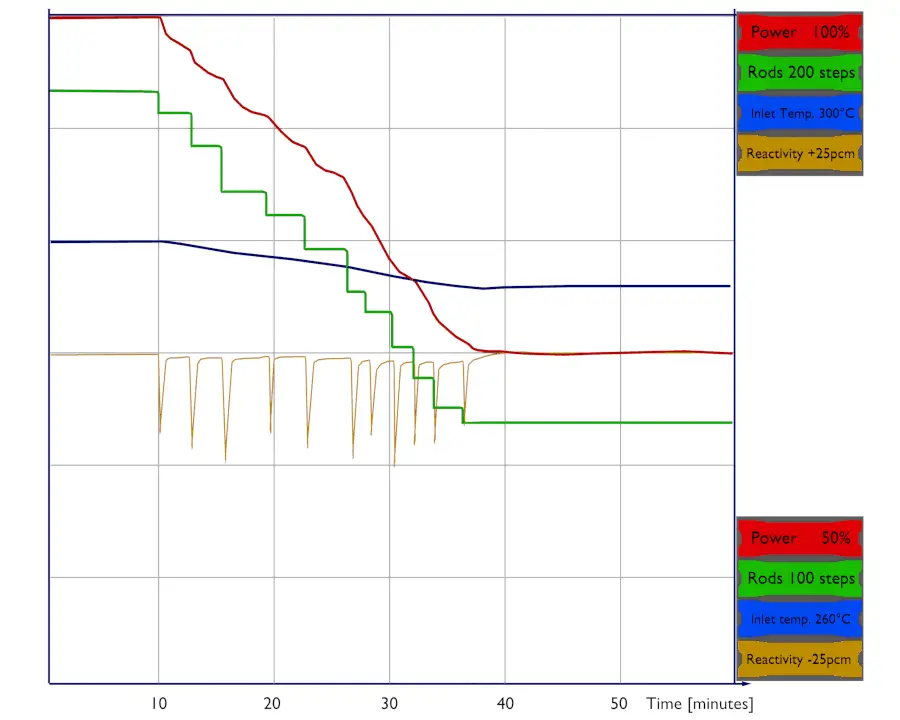 Smaller load changes do not require boron adjustment. For a power decrease, without using boron addition to overcome the positive reactivity added by the power defect, the control rods must be inserted to maintain Tavg. From this point on, with a continuing decrease in power, the pressure inside the steam generator will increase, adding negative reactivity.
Load Follow with Boron Adjustment
More extensive maneuvers usually require boron adjustment to compensate for xenon reactivity changes, thereby keeping the control rods within their axial flux distribution (AFD) target band. Boron concentration changes during plant operation are required whenever axial flux difference (AFD) would extend outside the allowable target band. As was written, this target band is, for example, +5% and -5% around the target value. Following the power level change made by the control rods, the plant operator or the control system makes boron concentration adjustments whenever the AFD approaches the limits of the target band.
Grey control rods
Some nuclear power plants use so-called “grey control rods” for load following. These plants have the capability to make power maneuvering between 30% and 100% of rated power, with a slope up to 5% of rated power per minute. They can respond very quickly to the grid requirements. Special control rods have to be used to fulfill these requirements without introducing a large perturbation of the power distribution. These control rods are called “grey” control rods. Grey control rods use a grey neutron absorber, which absorbs less neutrons than a “black” absorber. Consequently, they cause smaller depressions in the neutron flux and power in the vicinity of the rod. The rod control system automatically modulates the insertion of the axial offset (grey) control bank, which controls the axial power distribution.
In the case of the boiling water reactors (BWRs), the power regulation is performed by changing the coolant flow rate (using the recirculation pumps) and/or the control rods. No boron regulation is used in BWRs.