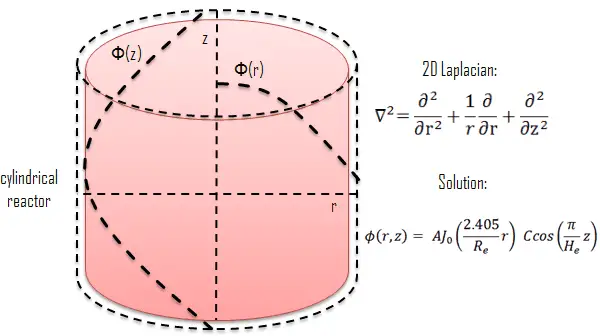
It should be noted the flux shape derived from the diffusion theory is only a hypothetical case in a uniform homogeneous cylindrical reactor at low power levels (at “zero power criticality”). We have implicitly assumed that the core consisting of thousands of fuel and control elements, coolant, and structure can be represented by some effective homogeneous mixture. This is a very strong assumption because it does not take into account the heterogeneity of a core.
See also: Diffusion Equation – Finite Cylindrical Reactor.
Heterogeneous Core
 Most of PWRs use uranium fuel, which is in the form of uranium dioxide. Uranium dioxide is a black semiconducting solid with very low thermal conductivity. On the other hand, uranium dioxide has a very high melting point and well-known behavior. The UO2 is pressed into pellets, and these pellets are then sintered into the solid.
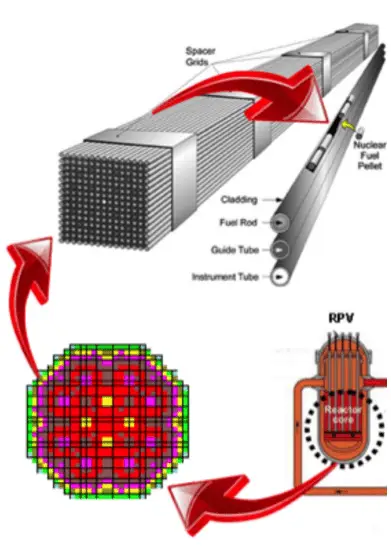
These pellets are then loaded and encapsulated within a fuel rod (or fuel pin) made of zirconium alloys due to their very low absorption cross-section (unlike stainless steel). The surface of the tube, which covers the pellets, is called fuel cladding. The collection of fuel rods or elements is called the fuel assembly. The fuel assembly constitutes the base element of the nuclear reactor core. The reactor core (PWR type) contains about 157 fuel assemblies (depending on a reactor type). Western PWRs use a square lattice arrangement, and assemblies are characterized by the number of rods they contain, typically 17×17 in current designs. The enrichment of fuel rods is never uniform. The enrichment is differentiated in the radial direction but also axial direction. This arrangement significantly influences the power distribution.
Russian VVER-type reactors use a fuel characterized by their hexagonal arrangement but is otherwise of similar length and structure to other PWR fuel assemblies.
Flux Distribution
In commercial reactor cores, the flux distribution is significantly influenced by:
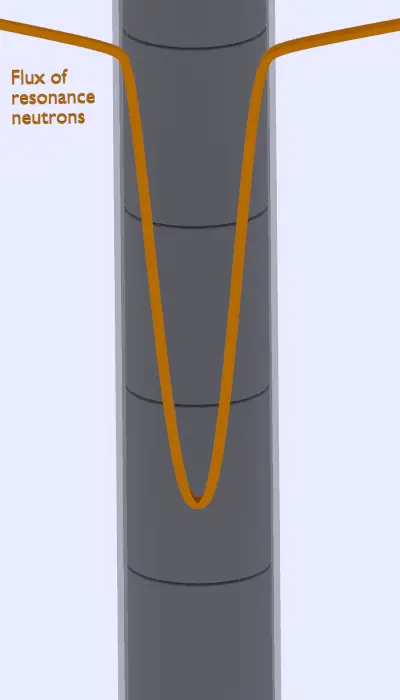 Heterogeneity of fuel-moderator assembly. The core’s geometry strongly influences the spatial and energy self-shielding primarily in heterogeneous reactor cores. In short, the neutron flux is not constant due to the heterogeneous geometry of the unit cell. The flux will be different in the fuel cell (lower) than in the moderator cell due to the high absorption cross-sections of fuel nuclei. This phenomenon causes a significant increase in the resonance escape probability (“p” from the four-factor formula) compared to homogeneous cores.
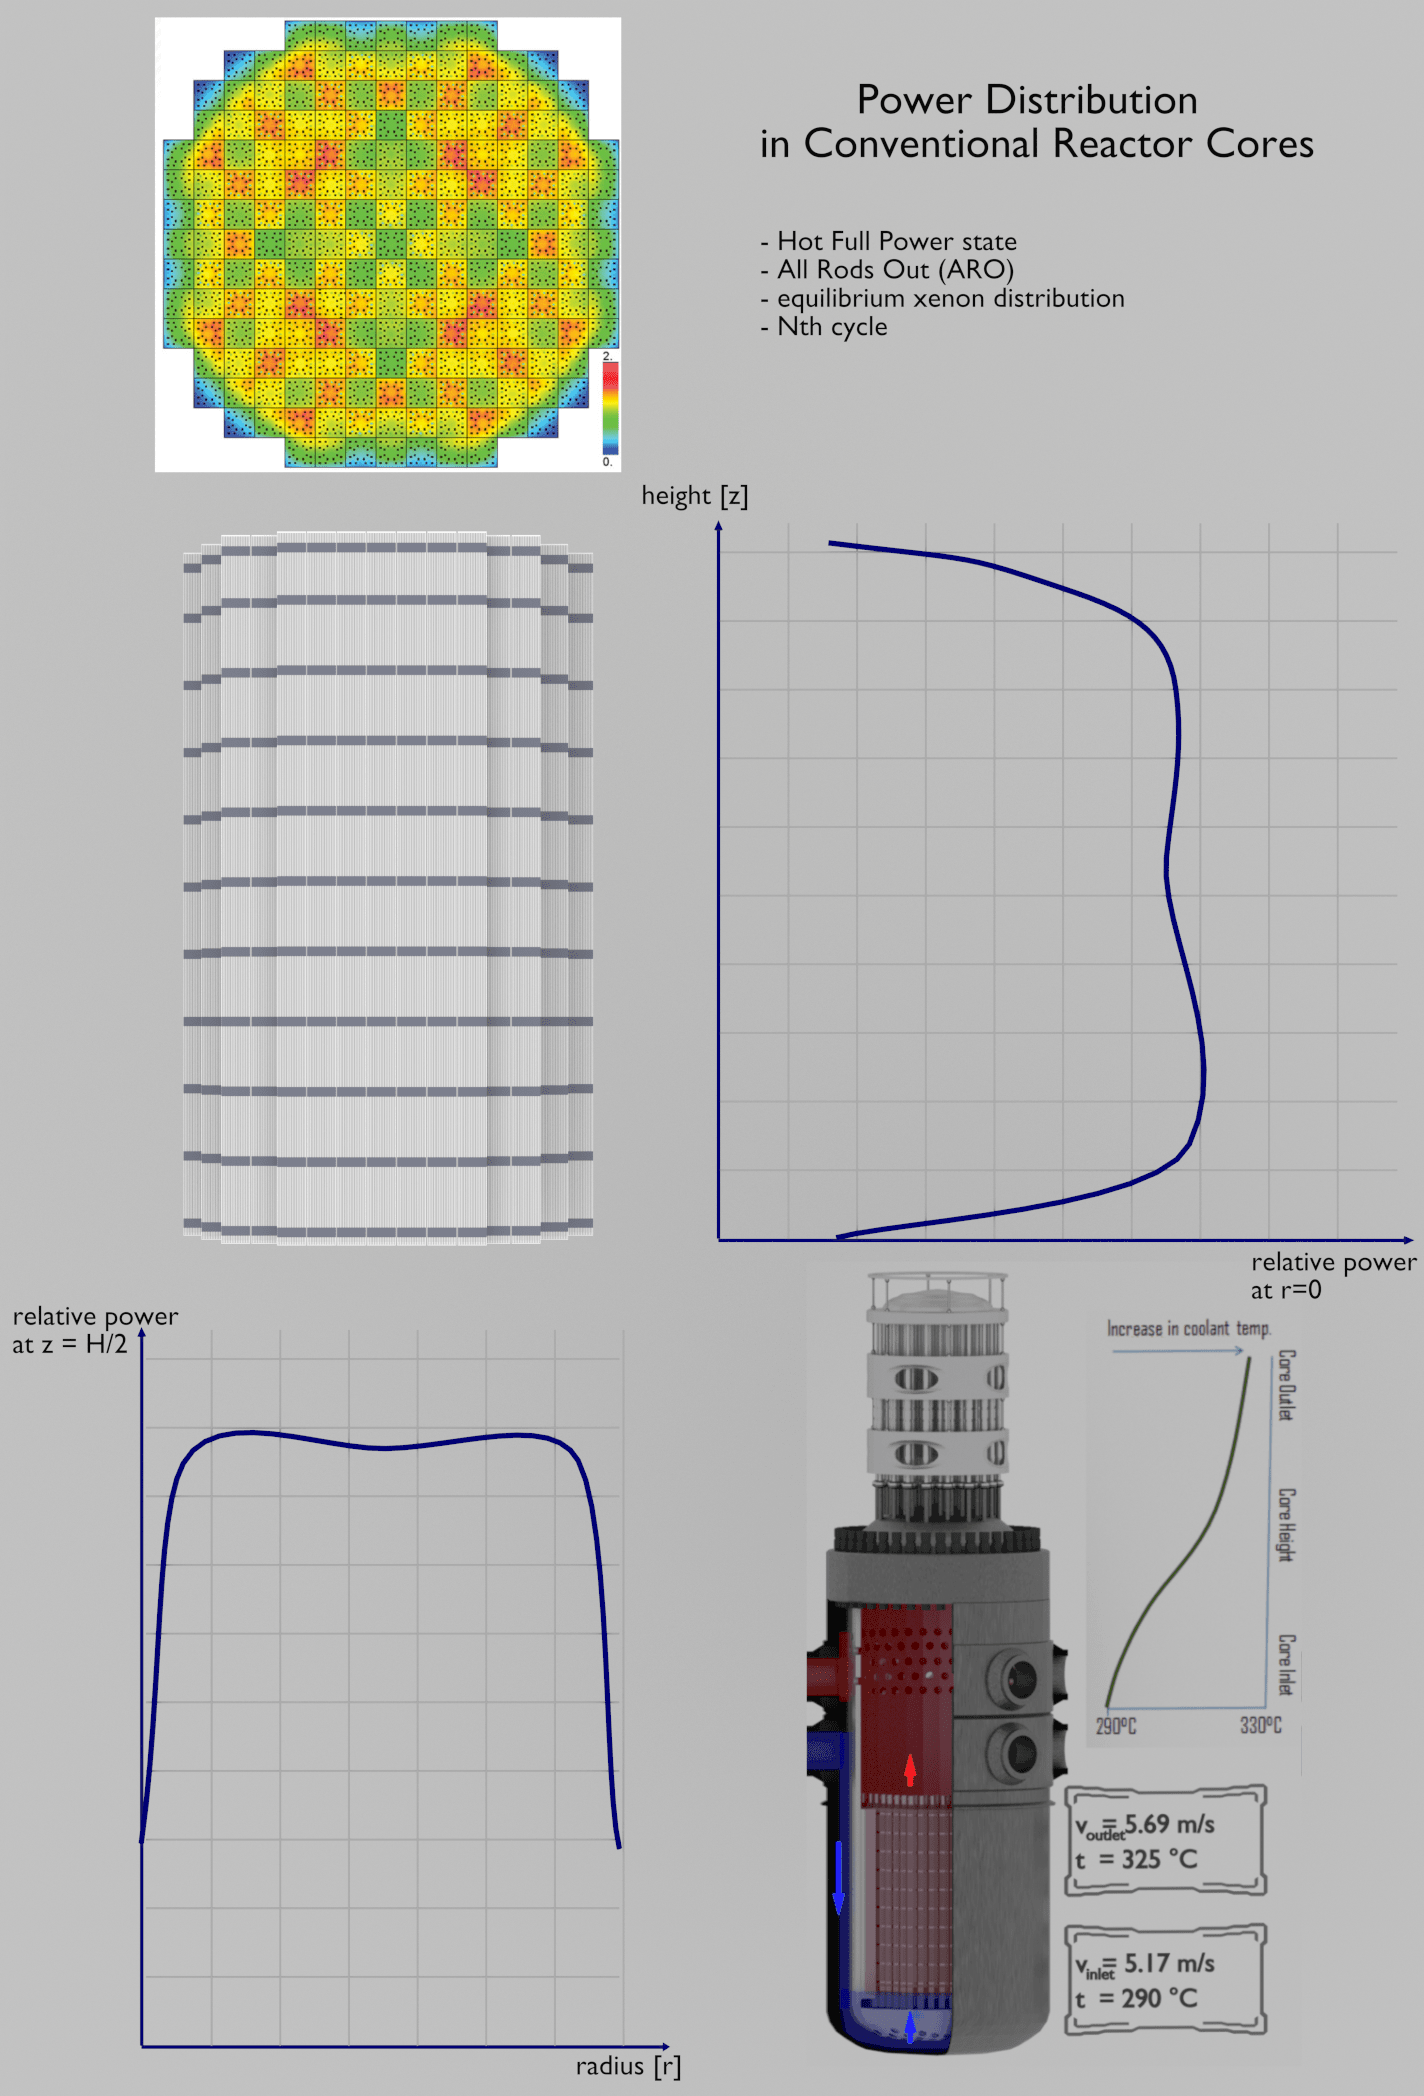
Reactivity Feedbacks. At power operation (i.e., above 1% of rated power), the reactivity feedbacks cause the flattening of the flux distribution because the feedbacks acts stronger on positions where the flux is higher. The neutron flux distribution in commercial power reactors depends on many other factors such as the fuel loading pattern, control rods position, and it may also oscillate within short periods (e.g.,, due to the spatial distribution of xenon nuclei). There is no cosine and J0 in the commercial power reactor at power operation.
Fuel Loading Pattern. The key feature of PWRs fuel cycles is that there are many fuel assemblies in the core. These assemblies have different multiplying properties because they may have different enrichment and different burnup. Generally, a common fuel assembly contains energy for approximately 4 years of operation at full power. Once loaded, the fuel stays in the core for 4 years, depending on the design of the operating cycle. During these 4 years, the reactor core has to be refueled. During refueling, every 12 to 18 months, some of the fuel – usually one-third or one-quarter of the core – is removed to the spent fuel pool. At the same time, the remainder is rearranged to a location in the core better suited to its remaining level of enrichment. The removed fuel (one-third or one-quarter of the core, i.e., 40 assemblies) must be replaced by fresh fuel assemblies.
Many different loading patterns have been considered, with the general conclusion that more energy is extracted from the fuel when the power distribution in the core is as flat as possible. In principle, these loading strategies may be divided into two categories:
- Out-In Loading Patterns. In the out-in loading pattern, the fresh fuel batch is placed at the periphery of the core, while the intermediate and high burnup batches are placed at the center of the core. The highest burnup batch is discharged at refueling, the other batches are shifted inward, and a fresh batch is loaded at the periphery. The out-in loading pattern has been found to go too far because the power distribution is depressed in the center and peaked at the periphery. An additional difficulty is producing many fast neutrons at the periphery that leak from the core and damage the pressure vessel.
- In-Out Loading Patterns. To enhance the neutron and fuel economy, core designers design the low leakage loading patterns. Fresh fuel assemblies are not situated in the peripheral positions of the reactor core. The peripheral positions are loaded with the fuel with the highest fuel burnup. Compared to the average assemblies, these “high” burnup assemblies have inherently lower relative power (due to the lower kinf and because they feel the presence of non-multiplying environment – reflector). During fuel depletion, the flux distribution at the periphery of the core increases, especially in low leakage loading patterns. This process is caused by reducing the differences in kinf between fresh fuel assemblies and peripheral high-burnup assemblies. Since the peripheral assemblies have low relative power, these loading patterns reach slightly higher peaking factors than Out-In loading patterns. On the other hand, enhanced neutron and fuel economy allow loading less fresh fuel or less enriched fuel during refueling. A secondary benefit is that loading the “high” burnup assemblies in the periphery reduces the neutron flux on the pressure vessel. This provides additional protection of the reactor vessel from irradiation embrittlement, caused especially by fast neutrons.
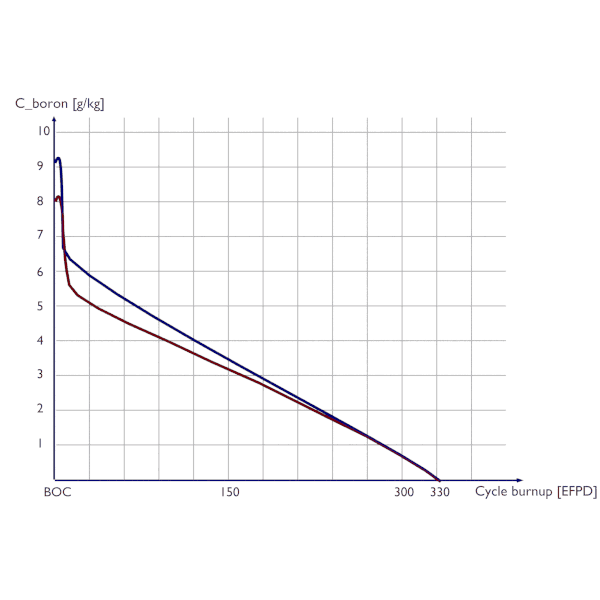
Burnable Absorbers (Burnable Poisons). Burnable absorbers significantly influence the pin-by-pin power distribution. Burnable absorbers are materials with a high neutron absorption cross-section converted into materials of relatively low absorption cross-section as the result of radiative capture. Due to the burnup of the absorption material, the negative reactivity of the burnable absorber decreases over core life. Ideally, these absorbers should decrease their negative reactivity while the fuel’s excess positive reactivity is depleted. In PWRs, burnable absorbers are used to decrease the initial concentration of boric acid (also decrease BOC MTC) and decrease the relative power of fresh fuel assemblies. Fixed burnable absorbers are generally used in the form of compounds of boron or gadolinium that are shaped into separate lattice pins or plates or introduced as additives to the fuel. Since they can usually be distributed more uniformly than control rods, these poisons are less disruptive to the core power distribution.
-
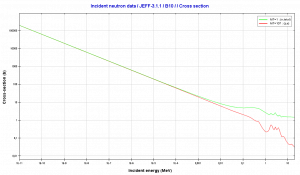
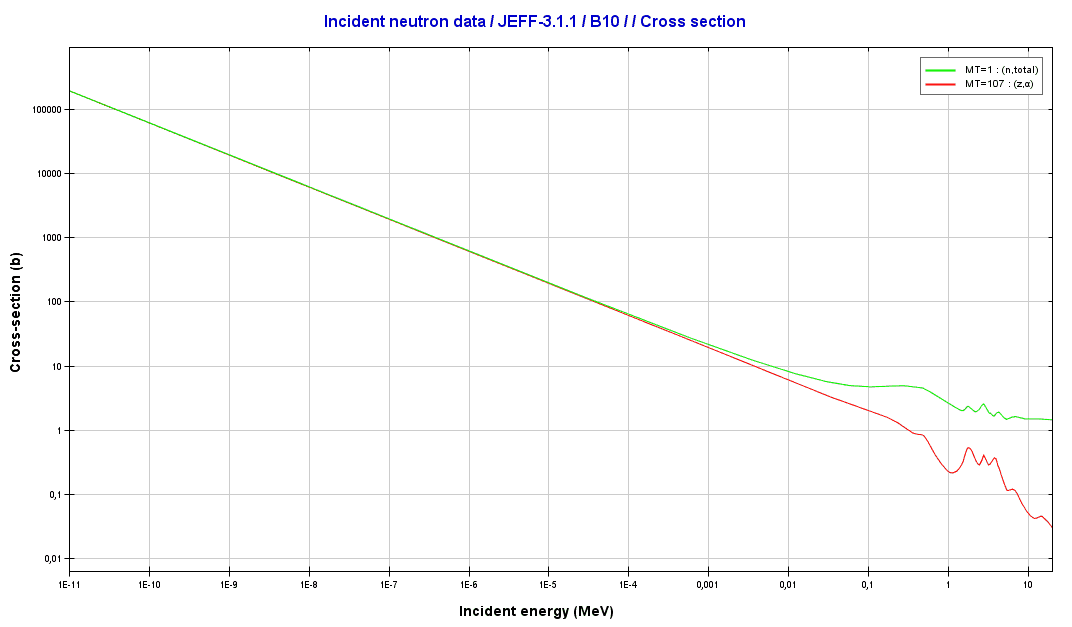
Boron 10. Comparison of total cross-section and cross-section for (n,alpha) reactions.
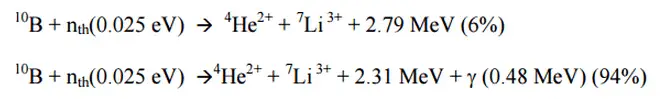
Source: JANIS (Java-based Nuclear Data Information Software); The JEFF-3.1.1 Nuclear Data LibraryBoron as Burnable Absorber. In the nuclear industry, boron is commonly used as a neutron absorber due to the high neutron cross-section of isotope 10B. Its (n,alpha) reaction cross-section for thermal neutrons is about 3840 barns (for 0.025 eV neutron). Isotope 11B has absorption cross-section for thermal neutrons about 0.005 barns (for 0.025 eV neutron). Most of (n,alpha) reactions of thermal neutrons are 10B(n,alpha)7Li reactions accompanied by 0.48 MeV gamma emission.
 Moreover, isotope 10B has a high (n, alpha) reaction cross-section along the entire neutron energy spectrum. The cross-sections of most other elements become very small at high energies, as in the case of cadmium. The cross-section of 10B decreases monotonically with energy. For fast neutrons, its cross-section is on the order of barns. Boron, as the neutron absorber, has another positive property. The reaction products (after a neutron absorption), helium and lithium, are stable isotopes. Therefore there are minimal problems with decay heating of control rods or burnable absorbers used in the reactor core. On the other hand, helium production may lead to a significant increase in pressure (under rod cladding) when used as the absorbing material in control rods. Moreover, 10B is the principal source of radioactive tritium in the primary circuit of all PWRs (which use boric acid as a chemical shim) because reactions with neutrons can rarely lead to the formation of radioactive tritium via:
- 10B(n,2x alpha)3H threshold reaction (~1.2 MeV)
- 10B(n,alpha)7Li(n,n+alpha)3H threshold reaction (~3 MeV).

-
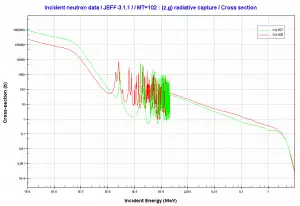
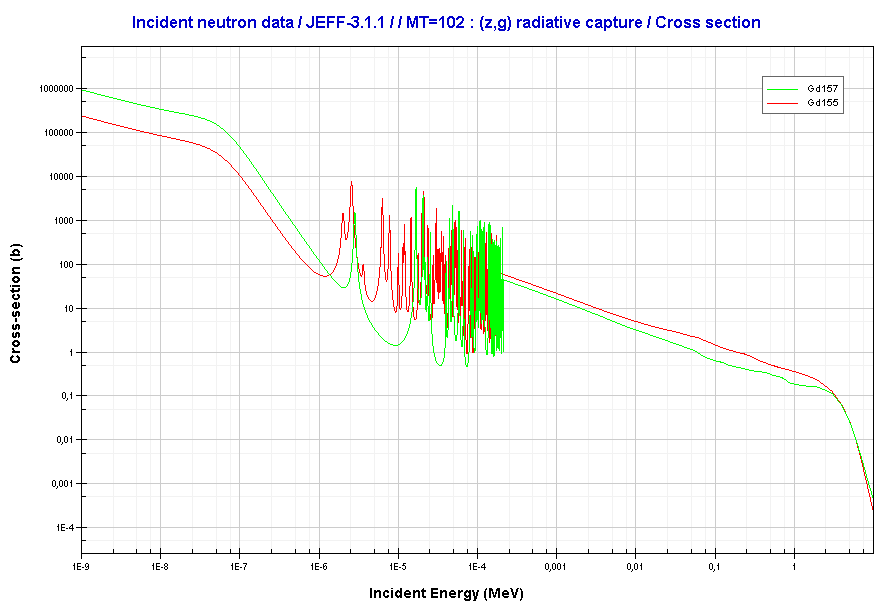
Gadolinium 155 and 157. Comparison of radiative capture cross-sections.
Source: JANIS (Java-based Nuclear Data Information Software); The JEFF-3.1.1 Nuclear Data LibraryGadolinium as Burnable Absorber. In the nuclear industry, gadolinium is commonly used as a neutron absorber due to the very high neutron absorption cross-section of two isotopes 155Gd and 157Gd. Their absorption cross-sections are the highest among all stable isotopes. 155Gd has 61 000 barns for thermal neutrons (for 0.025 eV neutron) and 157Gd has even 254 000 barns. For this reason, gadolinium is widely used as a burnable absorber, commonly used in fresh fuel to compensate for an excess of reactivity of reactor core. In comparison with other burnable absorbers, gadolinium behaves like a completely black material. Therefore gadolinium is very effective in compensation of the excess of reactivity. Still, on the other hand, improper distribution of Gd-burnable absorbers may lead to the unevenness of neutron-flux density in the reactor core.
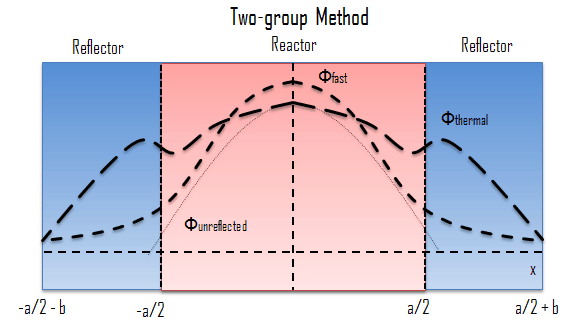
Presence of Neutron Reflector. The neutron reflector scatters back (or reflects) into the core many neutrons that would otherwise escape (i.e., reduces the neutron leakage). By reducing neutron leakage, the reflector increases keff and reduces the amount of fuel necessary to maintain the reactor critical for a long period. The neutron flux distribution is “flattened “, i.e., the ratio of the average flux to the maximum flux is increased. Therefore reflectors reduce the non-uniformity of the power distribution.
Operational factors that affect the power distribution
Effect of Fuel Depletion
During the reactor’s operation, the amount of fissile material contained in the fuel assembly constantly decreases. Therefore the assembly kinf constantly decreases. During fuel depletion, the decrease of the assembly kinf will be greatest where the power is greatest. The differences in kinf between fresh fuel assemblies and high-burnup assemblies decreases. Therefore during cycle depletion, this process will cause the power to shift away from regions with the highest kinf. This process also depends on the use of burnable absorbers, which disrupt the first assumption about the constantly decreasing assembly kinf.
Effect of Control Rods
Control rods are an important safety and control system of nuclear reactors. Their prompt action and prompt response to the reactor are indispensable. Control rods are used for maintaining the desired state of chain reaction within a nuclear reactor (i.e., subcritical state, critical state, supercritical state). They constitute a key component of an emergency shutdown system (SCRAM).
Control rods are removed from or inserted into the reactor core to increase or decrease the reactor’s reactivity (increase or decrease the neutron flux) at startup and power operation mode. By the changes of the reactivity, the changes of neutron power are performed. This, in turn, affects the reactor’s thermal power, the amount of steam produced, and hence the electricity generated.
This movement influences the neutron flux distribution radially and axially. The flux depression is naturally higher locally near inserted control rod, but control rods movements also act globally (e.g.,, influence axial flux difference).
Effect of flow rate
The following effects are valid for pressurized water reactors. Effects of changes in flow rate in boiling reactors are connected with changes in the intensity of boiling in channels, which causes these effects to be a more complex issue.
 In PWRs, the effect of change in the flow rate through the primary circuit has significant consequences on the axial power distribution. Still, in the case of PWRs, it is not common to change the flow rate through the core at power operation.
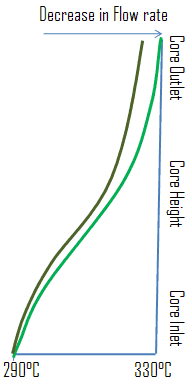
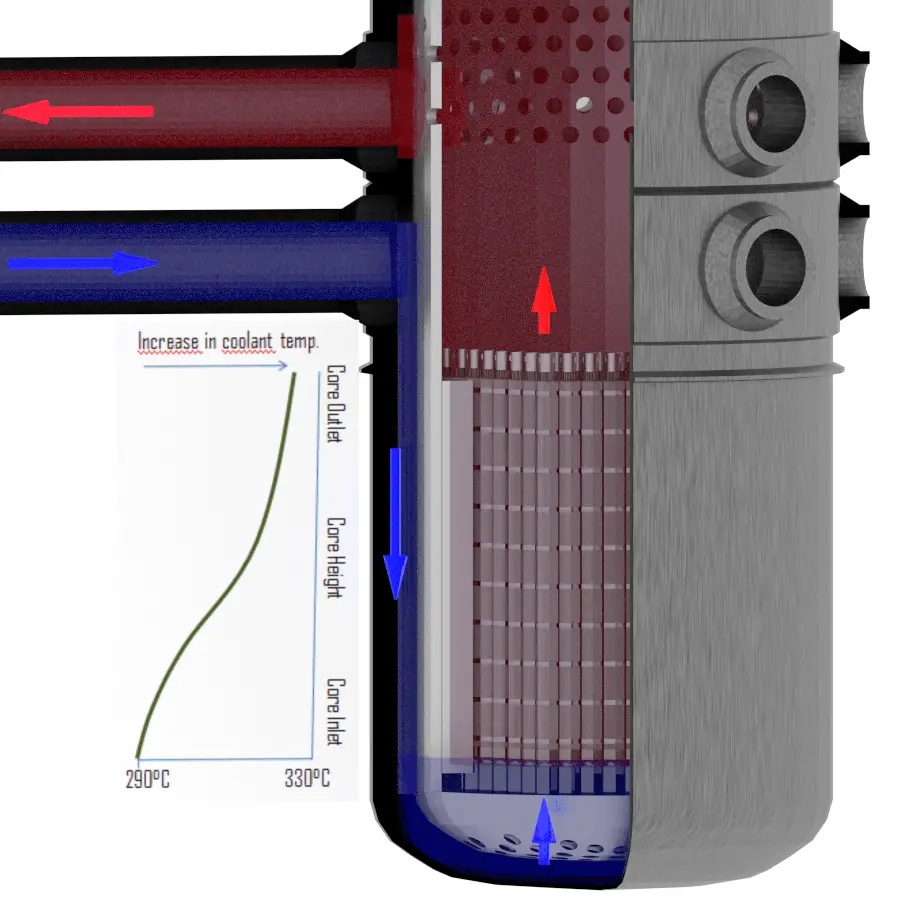
In reality, when there is an abrupt change (e.g.,, due to a disconnection of the reactor coolant pump) in the flow rate and the reactor power remains the same (e.g.,, at reduced power), the difference between inlet and outlet temperatures must increase. It follows from the basic energy equation of reactor coolant, which is below:
P=↓ṁ.c.↑∆t
The pressure determines the inlet temperature in the steam generators. Therefore the inlet temperature changes minimally during the transient. It follows the outlet temperature must change significantly as the flow rate changes. When the inlet temperature remains almost the same and the outlet changes significantly, it stands to reason, the average temperature of coolant (moderator) will also change significantly. It follows the temperature of the top half of the core increases (in case of flow rate reduction) more than the temperature of the bottom half of the core. Since the moderator temperature feedback must be negative, the power from the top half will shift to the bottom half. Hence the axial flux difference, defined as the difference in normalized flux signals (AFD) between the top and bottom halves of a two-section excore neutron detector, will decrease.
The decrease in flow rate is associated with negative reactivity insertion. Special attention is needed in case of an abrupt increase in the flow rate (positive reactivity insertion). At normal operation, such an increase in the flow rate can not occur, except for the controlled reactor coolant pump connection, which can be connected only under specific conditions.
Effect of xenon oscillations

Source: JANIS (Java-based Nuclear Data Information Software); The JEFF-3.1.1 Nuclear Data Library
Large thermal reactors with little flux coupling between regions may experience spatial power oscillations because of the non-uniform presence of xenon-135. Xenon-135 is a product of U-235 fission and has a very large neutron capture cross-section (about 2.6 x 10⁶ barns). It also decays radioactively with a half-life of 9.1 hours. Little of the Xe-135 results directly from fission, but most comes from the decay chain, Te-135 (β– decay, 0.5 min) to I-135 (β– decay, 6.6 hr) to Xe-135. The instantaneous production rate of xenon-135 is dependent on the iodine-135 concentration and, therefore, on the local neutron flux history. On the other hand, the destruction rate of xenon-135 is dependent on the instantaneous local neutron flux.
The combination of delayed generation and high neutron-capture cross-section produces a diversity of impacts on nuclear reactor operation. The mechanism is described in the following four steps.
- An initial lack of symmetry (let say the axial symmetry in case of axial oscillations) in the core power distribution (for example, as a result of significant control rods movement) causes an imbalance in fission rates within the reactor core, and therefore, in the iodine-135 buildup and the xenon-135 absorption.
- In the high-flux region, xenon-135 burnout allows the flux to increase further, while in the low-flux region, the increase in xenon-135 causes a further reduction in flux. The iodine concentration increases where the flux is high and decreases where the flux is low. This shift in the xenon distribution is to increase (decrease) the multiplication properties of the region in which the flux has increased (decreased), thus enhancing the flux tilt.
- As soon as the iodine-135 levels build up sufficiently, decay to xenon reverses the initial situation. Flux decreases in this area, and the former low-flux region increases in power.
- Repetition of these patterns can lead to xenon oscillations moving about the core with periods of about 24 hours.
With little change in the overall power level, these oscillations can change the local power levels significantly. In a reactor system with strong negative temperature coefficients, the xenon-135 oscillations are damped quite readily. This is one of the reasons for designing reactors to have negative moderator-temperature coefficients. Since this effect influences global power distribution in the core, it also influences local power distribution. The problem, however, is in the initial swing of flux levels which displace the flux upward. Since at the higher elevations, the local linear heat rate (FQ(z) limit) is highly restrictive, large xenon spatial oscillations have to be minimized to prevent exceeding FQ limits.
The axial flux difference or the axial offset are introduced to control xenon spatial oscillations. The most important of these are the axial flux difference (AFD) limits. AFD measures the imbalance between the upper and lower halves of the core in terms of power or flux (ΔI). The AFD is determined from the outputs of the upper and lower excore neutron detectors, which belong to the so-called excore nuclear instrumentation system (NIS).
AFD is defined as:
AFD or ΔI = Itop – Ibottom
where Itop and Ibottom are expressed as a fraction of rated thermal power.
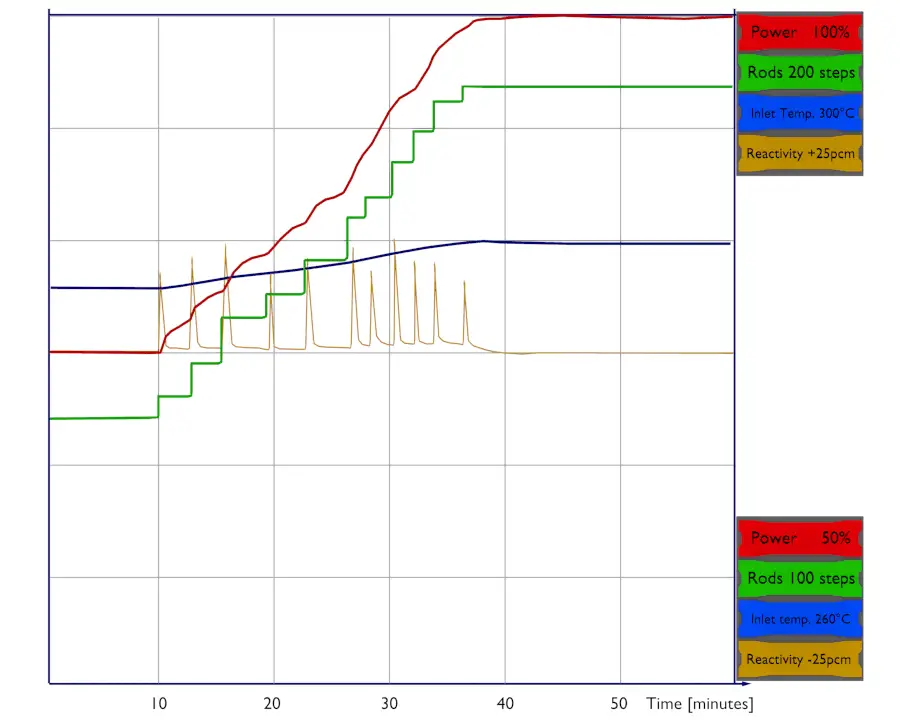
Effect of Thermal Power
The power distribution significantly changes also with changes in the thermal power of the reactor. During power changes at power operation mode (i.e., from about 1% up to 100% of rated power), the temperature reactivity effects play a very important role. As the neutron population increases, the fuel and the moderator increase their temperature, which results in a decrease in reactivity of the reactor (almost all reactors are designed to have the temperature coefficients negative). The negative reactivity coefficient acts against the initial positive reactivity insertion, and this positive reactivity is offset by negative reactivity from temperature feedbacks.
This effect naturally occurs on a global scale and also on a local scale.
During thermal power increase, the effectiveness of temperature feedbacks will be greatest where the power is greatest. This process causes the flattening of the flux distribution because the feedbacks acts stronger on positions where the flux is higher.
It must be noted, the effect of change in the thermal power has significant consequences on the axial power distribution.
In reality, when there is a change in the thermal power, and the coolant flow rate remains the same, the difference between inlet and outlet temperatures must increase. It follows from the basic energy equation of reactor coolant, which is below:
P=↓ṁ.c.↑∆t
The inlet temperature is determined by the pressure in the steam generators. Therefore the inlet temperature changes minimally during the change of thermal power. It follows the outlet temperature must change significantly as the thermal power changes. When the inlet temperature remains almost the same and the outlet changes significantly, it stands to reason, the average temperature of coolant (moderator) will also change significantly. It follows the temperature of the top half of the core increases more than the temperature of the bottom half of the core. Since the moderator temperature feedback must be negative, the power from the top half will shift to the bottom half. In short, the top half of the core is cooled (moderated) by hotter coolant, and therefore, it is worse moderated. Hence, the axial flux difference will decrease, defined as the difference in normalized flux signals (AFD) between the top and bottom halves of a two-section excore neutron detector.
AFD is defined as:
AFD or ΔI = Itop – Ibottom
where Itop and Ibottom are expressed as a fraction of rated thermal power.