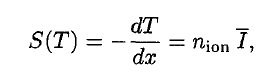
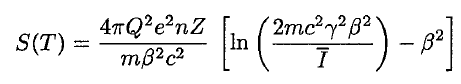
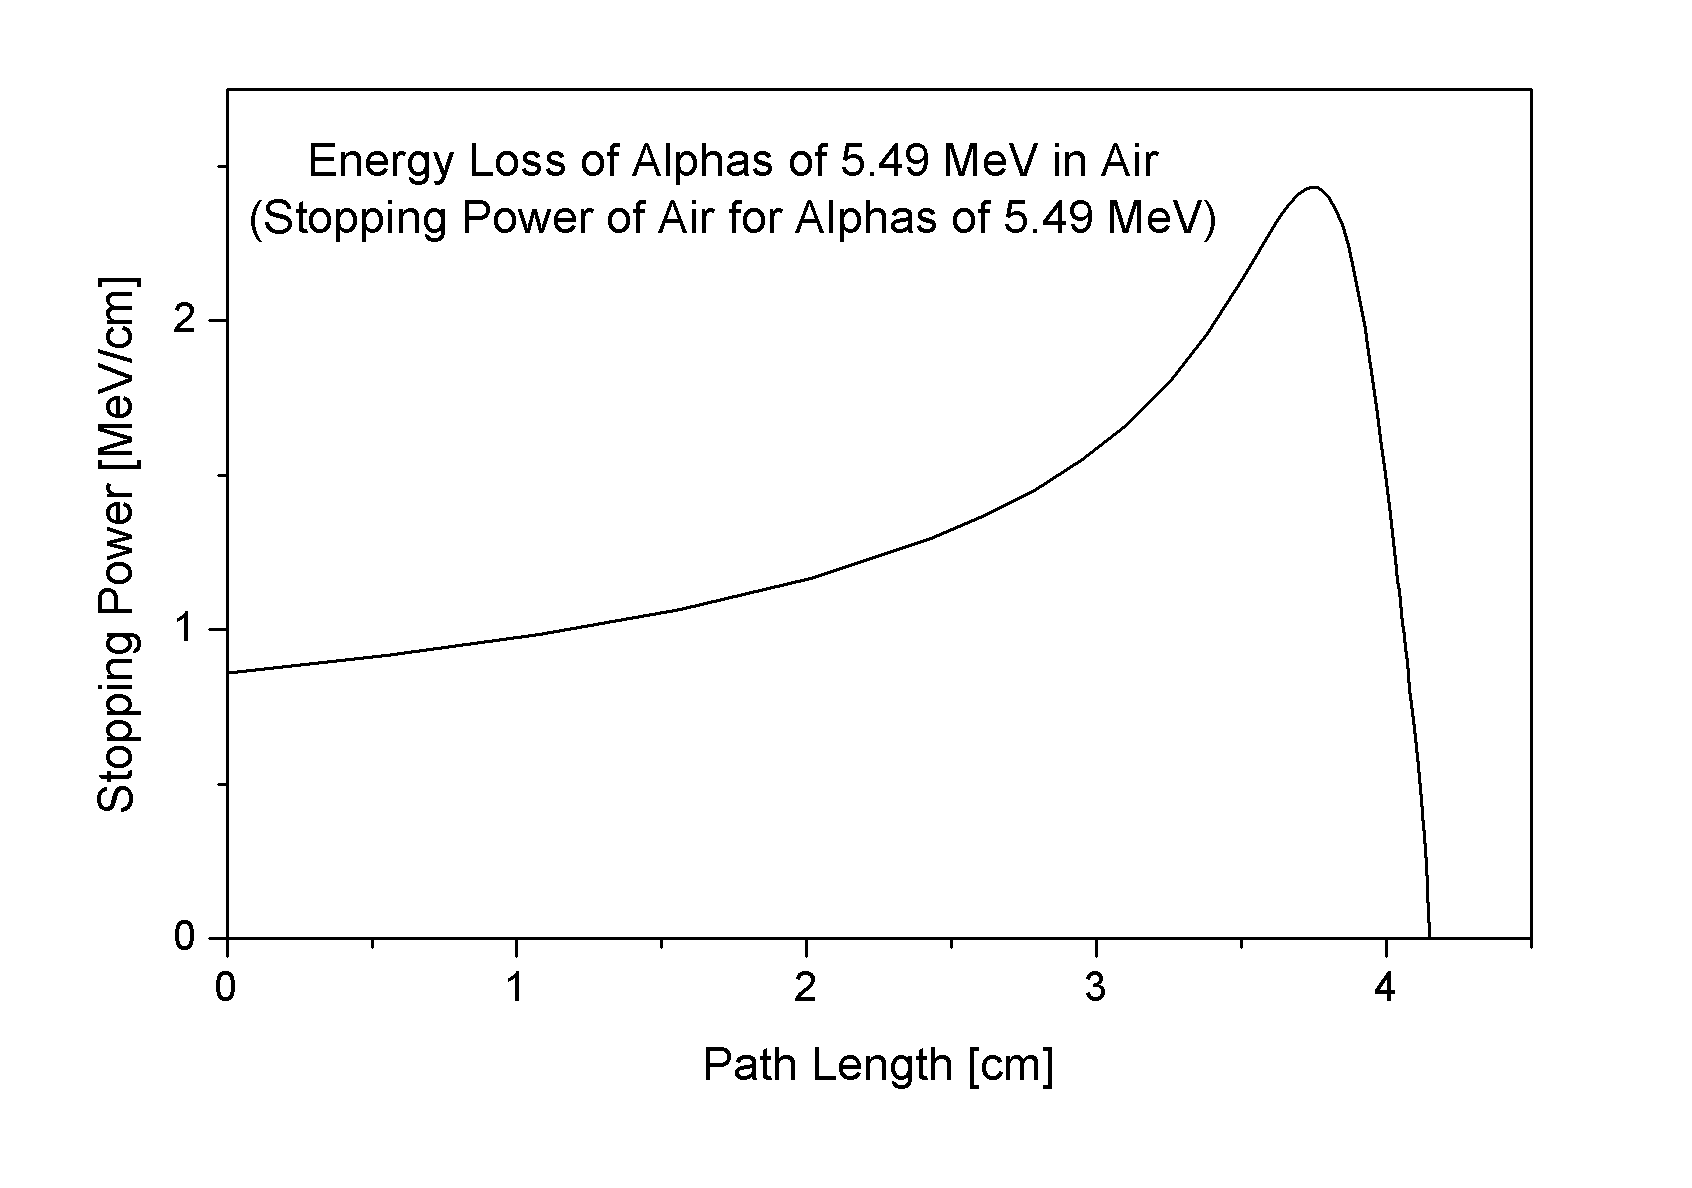
The Bragg curve is typical for heavy-charged particles and describes the energy loss of ionizing radiation during travel through matter. This curve is typical of the Bragg peak, which results from 1/v2 dependency of the stopping power. This peak occurs because the cross-section of interaction increases immediately before the particle comes to rest. The charge remains unchanged for most of the track, and the specific energy loss increases according to the 1/v2. Near the end of the track, the charge can be reduced through electron pickup, and the curve can fall off.
Source: wikipedia.org
The Bragg curve also differs somewhat due to the effect of straggling. For a given material, the range will be nearly the same for all particles of the same kind with the same initial energy. Because the details of the microscopic interactions undergone by any specific particle vary randomly, a small variation in the range can be observed. This variation is called straggling, and it is caused by the statistical nature of the energy loss process, which consists of many individual collisions.
This phenomenon, described by the Bragg curve, is exploited in particle therapy of cancer because this allows concentrating the stopping energy on the tumor while minimizing the effect on the surrounding healthy tissue.